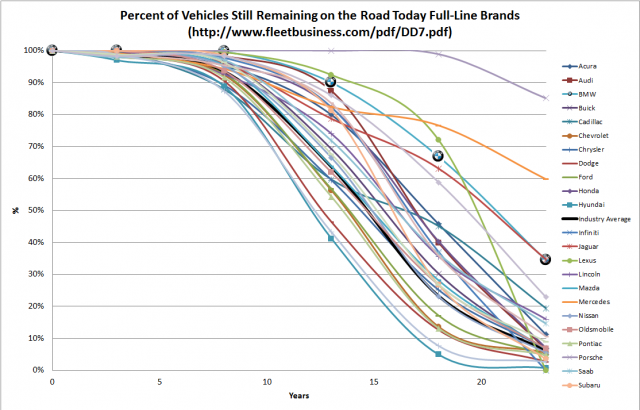
This is from a Canadian study. I'm assuming the US would look similar. Anyone know where I could find this information for US?
I'm curious how the e9x N55/54/52/51 would look like as the years progressed.
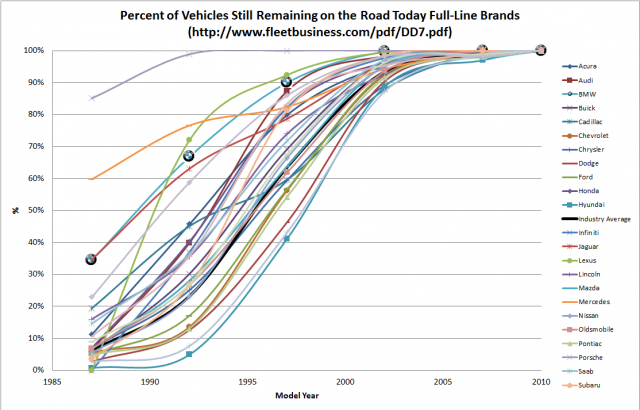
edit: This data was gathered in 2010. This reversed graph may be easier to grasp
They explain why Porche is so high. In Canada, it is easier to import from US than to find one in Canada.